Welcome to my first ever blog post. I will keep this one short and simple as a way for me to practice using the WordPress blog system.
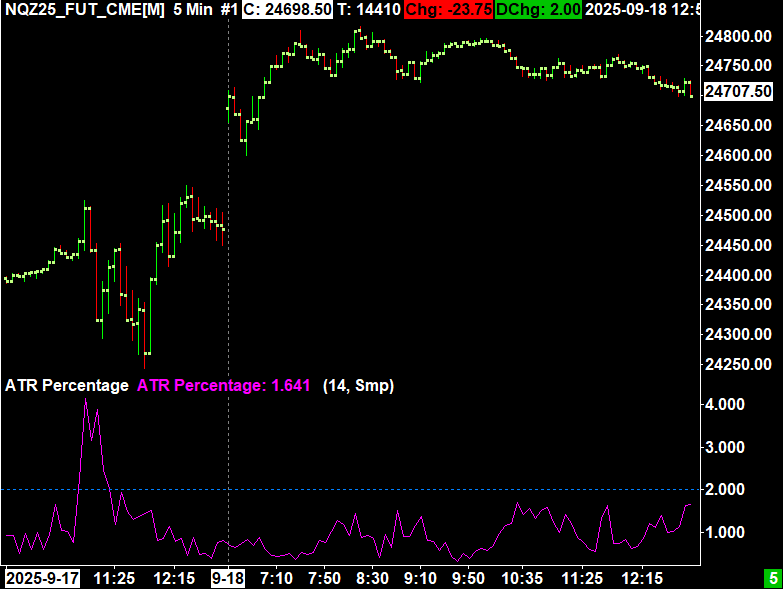
This post will include the source code for a Sierra Chart study which will show the current bar’s range as a percentage of a historical ATR. The length and moving average type of the historical ATR can be chosen through the inputs.
I personally use this study intra-day as an alert for sudden increases in volatility. This is done by using Sierra Chart’s built in chart drawing alert feature.
Code
SCSFExport scsf_ATRPercentage(SCStudyGraphRef sc)
{
	auto& ATRSubgraph = sc.Subgraph[0];
	auto& ATRPercentSubgraph = sc.Subgraph[1];
	auto& ATRLengthInput = sc.Input[0];
	auto& ATRTypeInput = sc.Input[1];

	if (sc.SetDefaults)
	{
		sc.GraphName = "ATR Percentage";

		sc.AutoLoop = 1;

		ATRLengthInput.Name = "ATR Length";
		ATRLengthInput.SetInt(14);

		ATRTypeInput.Name = "ATR Type";
		ATRTypeInput.SetMovAvgType(MOVAVGTYPE_SIMPLE);

		ATRSubgraph.Name = "ATR";
		ATRSubgraph.DrawStyle = DRAWSTYLE_IGNORE;

		ATRPercentSubgraph.Name = "ATR Percentage";
		ATRPercentSubgraph.DrawStyle = DRAWSTYLE_LINE;
	}

	auto Length = sc.Input[0].GetInt();
	auto MovAvgType = sc.Input[1].GetMovAvgType();

	sc.ATR(sc.BaseData, ATRSubgraph, Length, MovAvgType);

	auto& CurrentBarHigh = sc.BaseData[SC_HIGH][sc.Index];
	auto& CurrentBarLow = sc.BaseData[SC_LOW][sc.Index];
	auto CurrentBarRange = CurrentBarHigh - CurrentBarLow;

	ATRPercentSubgraph[sc.Index] = CurrentBarRange / ATRSubgraph[sc.Index];
}