Introduction
Welcome to my Sierra Chart Automated Trading Basics blog post. This blog post will cover how to submit orders and get position data using Sierra Chart’s ACSIL. This is not meant to serve as a complete tutorial, but rather a nice reference point for beginners. The full documentation for ACSIL can be found here.
Sierra Chart Settings
Before getting into the code, there are a few settings within Sierra Chart that need to be enabled to allow for automated trading.
- Trade >> Auto Trading Enabled – Global
- Trade >> Auto Trading Enabled – Chart
- Trade >> Trade Simulation Mode
Furthermore, there are additional settings that must be changed in order to submit orders to a live exchange. However, I will not cover those here and will leave that as an exercise to the reader. If you don’t want to figure that out, you probably shouldn’t be doing live automated trading. 😅
Submitting Orders
Sierra Chart handles orders through a structure they call SCNewOrder. You can populate this order structure with information relating to the order; such as quantity, order type, symbol, and more. For this example, we keep it simple with a single lot market order on the current symbol.
	s_SCNewOrder OneLotMarket;
	OneLotMarket.OrderQuantity = 1;
	OneLotMarket.OrderType = SCT_ORDERTYPE_MARKET;
	OneLotMarket.Symbol = sc.Symbol;
Once you have populated your desired SCNewOrder you can pass it to the BuyEntry or SellEntry methods which will execute the trade as a new long or short position respectively. In order to close out of a trade, you pass the SCNewOrder structure to the BuyExit or SellExit methods.
Checking Position
Sierra Chart provides a method for retrieving current position data named GetTradePosition. It provides information about the current trade position including trade quantity, symbol, average price, and more. This information can and will be used for trading and risk management logic.
Trading Logic
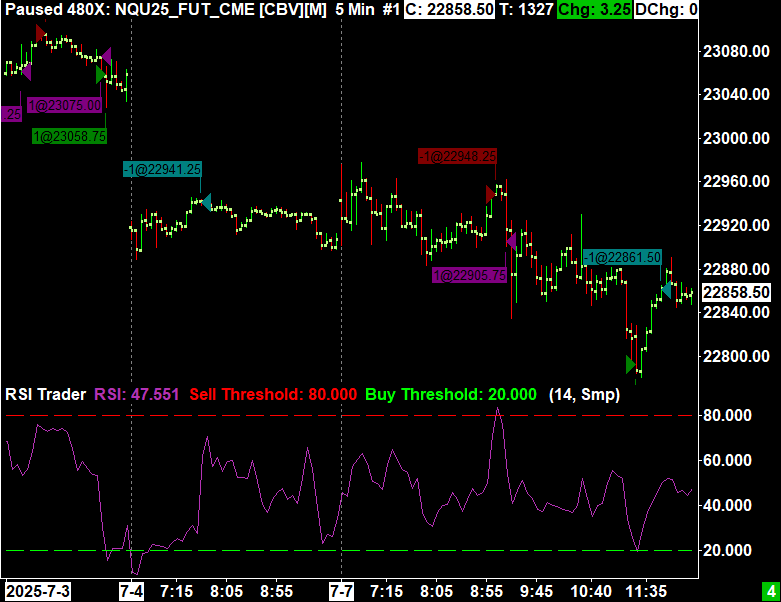
The trading logic for this study is based on RSI and kept exceptionally simple. The study will enter a short position whenever RSI exceeds 80, enter a long when RSI is below 20, and close the trades whenever RSI has crossed 50.
Code
The full source code of the study has many more lines than shown in the code block to the right due to setting defaults and naming variables. To keep the code block as readable as possible, I excluded much of the unimportant “filler” lines. Feel free to view the entirety of the source code by downloading a copy using the link below.
The code block clearly demonstrates how to create a new SCNewOrder, fill the order with information, and then act upon the order depending on other factors.
SCSFExport scsf_RSITrader(SCStudyGraphRef sc)
{
	s_SCNewOrder OneLotMarket;
	OneLotMarket.OrderQuantity = 1;
	OneLotMarket.OrderType = SCT_ORDERTYPE_MARKET;
	OneLotMarket.Symbol = sc.Symbol;

	sc.RSI(sc.BaseDataIn[SC_LAST], RSISubgraph, RSIAvgType, RSILength);
	auto& CurrentRSI = RSISubgraph[sc.Index];

	s_SCPositionData PositionData;
	sc.GetTradePosition(PositionData);

	/* If position quantity is non-zero, handle position exit */
	if (PositionData.PositionQuantity)
	{
		if (CurrentRSI > 50 && PositionData.PositionQuantity > 0)
			sc.BuyExit(OneLotMarket);
		else if (CurrentRSI < 50 && PositionData.PositionQuantity < 0)
			sc.SellExit(OneLotMarket);

		return;
	}

	/* Else, handle new positions */
	if (CurrentRSI > SellThreshold)
		sc.SellEntry(OneLotMarket);
	else if (CurrentRSI < BuyThreshold)
		sc.BuyEntry(OneLotMarket);
}
Final Result
After building the file into a finished DLL and loading into Sierra Chart, this is what it looks like. The RSI is plotted as a purple solid line, while the buy/sell thresholds are represented as dotted green/red lines.
Is the strategy any good?
While this strategy is exceptionally simple, it provides interesting results. I ran a back test of the strategy with default study settings on 5 min NQU25 futures from April 2nd to September 18th. The strategy made 232 trades with an average profit per trade of 3.85 points for a total gain of 893.75 points. The winning percentage was 66.81% and the profit factor was 1.13.
If you’d like to view the full statistics and trade log, the links to the data are below.

Thank you for reading. I hope you learned something new.